Q2:ipmat indore 2019LRDI › Bar GraphsEasyMCQ · MCQ
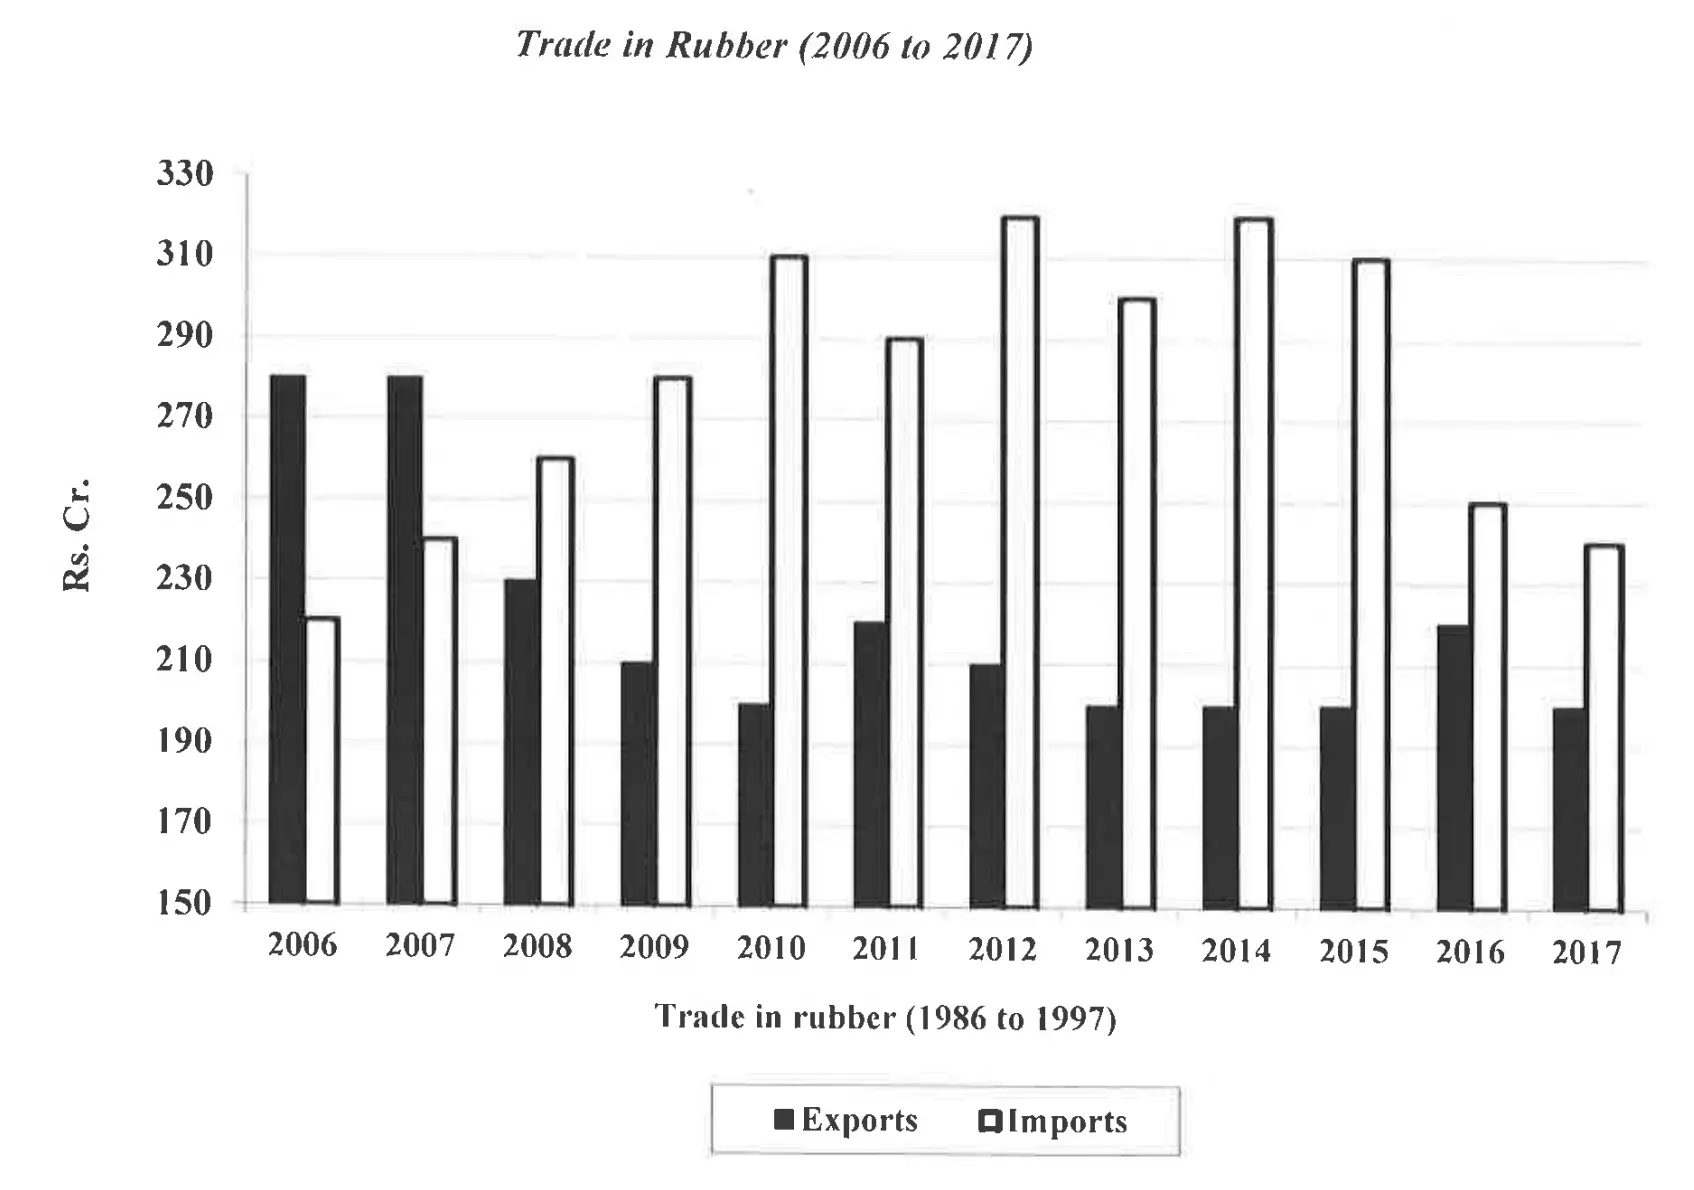
Analyze the given data for exports and imports of rubber in Rs. crores from 2006 to 2017 and answer the questions based on the analysis.
The percentage decline in exports during the period 2006-2011 is more than the percentage decline in exports during 2012-2017 by approximately
A16.5
B20.5
C12.5
D21.5
Pick an option to attempt
Percentage decline during 2006-2011 period =2006 exportsDifference between 2006 and 2011 exports×100
=280280−220×100=28060×100=approximately 21.42%
Now, percentage decline during 2012-2017 period will be calculated similarly.
=210210−200×100=21010×100=approximately 4.76%
As we can see, the first percentage is more than the second by approximately 16.5, hence Option 1 is the answer.
Final Answer: 16.5
Q3:ipmat indore 2019LRDI › Bar GraphsEasyMCQ · MCQ
Analyze the given data for exports and imports of rubber in Rs. crores from 2006 to 2017 and answer the questions based on the analysis.
The maximum difference between imports and exports is
ARs. 60 Cr
BRs. 110 Cr
CRs. 120 Cr
DRs. 100 Cr
Pick an option to attempt
The phrase *difference between imports and exports* means the gap within a single year - the two bars standing side by side - so we compare year by year rather than picking the tallest bar from one year and the shortest from another.
Reading the pairs off the chart and measuring the size of the gap between the two bars. Note that in 2006 and 2007 exports were the higher of the two, so the gap runs the other way in those years - what matters is how far apart the bars stand, not which is on top:
Year
Imports
Exports
Gap
2006
220
280
60
2007
240
280
40
2008
260
230
30
2009
280
210
70
2010
310
200
110
2011
290
220
70
2012
320
210
110
2013
300
200
100
2014
320
200
120
2015
310
200
110
2016
250
220
30
2017
240
200
40
The largest gap is in 2014, where imports peak at Rs. 320 Cr while exports sit at their floor of Rs. 200 Cr:
320−200=Rs. 120 Cr
A shortcut is tempting here - take the tallest import bar anywhere (320, in 2012 and 2014) and subtract the shortest export bar anywhere (200, in 2010, 2013, 2014, 2015 and 2017). It gives the right number only because 2014 happens to hold both extremes at once. On a chart where the highest import and the lowest export fell in different years, that shortcut would compare two bars that never coexist and overstate the answer. Scanning the pairs is the reliable route.
Final Answer: Rs. 120 Cr
Q4:ipmat indore 2019LRDI › Bar GraphsEasyMCQ · MCQ
Analyze the given data for exports and imports of rubber in Rs. crores from 2006 to 2017 and answer the questions based on the analysis.
Balance of trade is defined as imports subtracted from exports ( = exports - imports). Which of the following blocks of three years has witnessed the largest average negative balance of trade?
A2007-2009
B2015-2017
C2014-2016
D2010-2012
Pick an option to attempt
For 2007-2009: 2007: 280−240=40 2008: 230−260=−30 2009: 210−280=−70
Average = 340−30−70=−20
For 2015-2017: 2015: 200−310=−110 2016: 220−250=−30 2017: 200−240=−40
Average = 3−110−30−40=−60
For 2014-2016: 2014: 200−320=−120 2015: 200−310=−110 2016: 220−250=−30
Average = 3−120−110−30=−86.67
For 2010-2012: 2010: 200−310=−110 2011: 220−290=−70 2012: 210−320=−110
Average = 3−110−70−110=−96.67
After comparing, the period 2010-2012 has the largest negative average balance of trade at −96.67 crores, making it the correct answer.
Final Answer: 2010-2012
Q5:ipmat indore 2019LRDI › Bar GraphsEasyMCQ · MCQ
Analyze the given data for exports and imports of rubber in Rs. crores from 2006 to 2017 and answer the questions based on the analysis.
The percentage increase in imports over the previous year is maximum during
A2009 to 2010
B2010 to 2011
C2013 to 2014
D2008 to 2009
Pick an option to attempt
The percentage increase in imports for each given option using the formula: Original ValueNew Value - Original Value×100